Lepida's Big Data infrastructure was launched in the production environment, after a period of study and experimentation and an evaluation of possible alternative solutions; the Oracle Cloud was chosen, and in particular the Oracle Big Data Service (BDS) consisting of a Cloudera distribution, engineered and adapted for automatic deployment within the Cloud infrastructure. The architecture has therefore undergone some changes, having to adapt to the new tools made available by clouding.
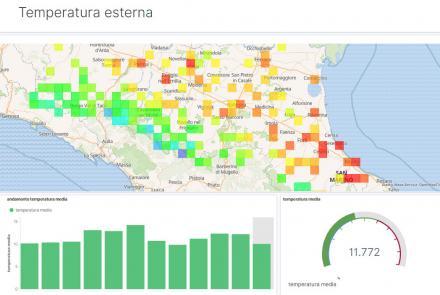
The infrastructure allows the ingestion of flows of different nature, each requiring the creation of an ad hoc module. Data are processed in successive steps, according to privacy regulations. Raw data remain stored in the cloud for the period of time expected depending on the type of data, and are subjected to different degrees of processing that provides, for example, aggregations and cross-references with different datasets to extract information according to the desired output. At the moment, the logs of the Access Points (AP) displaying the EmiliaRomagnaWiFi network and the data detected by the sensors present in the SensorNet network are acquired. For the data coming from the SensorNet network, after the possible pseudo-anonymisation of the personal data, the processing provides for the enrichment of some information and therefore the filtering and aggregation for the desired displays. It is therefore possible to show geolocalized averages on the maps of the measured values - temperature, humidity, fine dust levels, raining etc. - and correlate the different measurements. AP data require more complex processing: the capture and transformation of the received logs into single events; the filtering of events of interest and the pseudo-anonymization of data, prior to data storage; the enrichment, with geolocation information and data aggregation. The result of these distillation processes is a higher level of information, able to answer questions such as: which new devices connect to the network for the first time and their number, how many devices connect daily, how users move within the region.
To allow the fruition of data and therefore of results, data are stored and displayed through two tools: ElasticSearch/Kibana and Metabase with DB Postgres, both installed on-prem. The dashboards created respond visually to these questions by monitoring data and their relationships, evaluating both the trend over time and the geographical distribution. The information and graphs displayed will have different types of recipients: the Public Body, for data control and as a decisional tool; the citizen, for informative purposes and for monitoring the data made available by the Bodies.